Using Exported Data in Excel |

|

|

|
|
Using Exported Data in Excel |
|
|

|
Using Exported Data in Excel |
|
|
|
|
Using Exported Data in Excel |
|
|
|
|
|
||
When you have created a report you can export the report data and use Excel to present the data in a number of ways.
To use Excel to present your data:
| 1. | When you have run your report select the option "Export to CSV". |
| 2. | Open the file with Excel. |
| 3. | The exported data will be shown in Excel ready for you to apply formatting and present the data as required.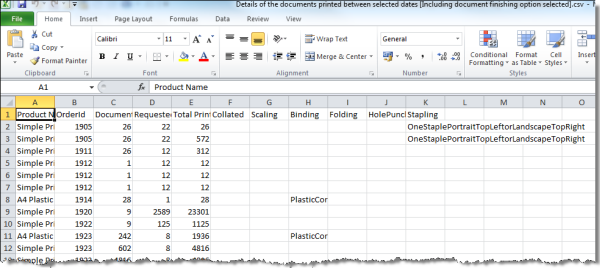 |
Sub-totals
The Excel feature Subtotal was used on the exported data to show the total number of pages printed for each product type during the period selected when the report was run.

Example showing the use of the Excel feature Sub-total
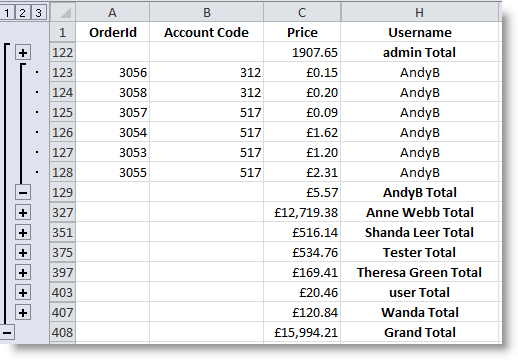
This feature can be used to provide sub-totals as required from your exported data. Another example is shown below giving details of costs for each user.
Pivot Tables
Pivot tables can be used to summarize the exported data. Data can be sorted and grouped and the count of items or a sum can be shown. Before creating a pivot table you need to be clear on what you want to show. In the example below the total number of pages printed for all account codes is shown. Using the pivot table you could show just the pages printed for each of the account codes.

Pivot Table Example showing all the account codes
Depending on the data you export you can use pivot tables to show pricing breakdowns. The example below shows the price of an order grouped by account code. A total price for each account code is shown. You can also show the orders against each account code. The example shows the information for a single user called "admin". Using the filter you could select other users of show details for all users.

Pivot Table example showing orders placed, grouped by Account Code
Pivot Table Chart - When you have created a pivot table you can easily display the data graphically.

Example of a chart produced from the pivot table.